In my last post, we looked at accounts receivable as a key driver of cash flow. And we looked at specific tips to help you better monitor and manage the impact accounts receivable has on your cash flow.
In this post, I show you how to write the one line explanation in your Cash Flow Focus Report, and determine whether the change is good or bad, when one of the three largest drivers of cash is inventory. I also share some specific tips for managing inventory wisely.
A positive number – A positive adjustment to cash related to inventory indicates you sold more inventory during the month than you bought. (Inventory on your balance sheet went down for the month.) Step 1 is to consider what caused the change. And does the change make sense compared to expectation. For example, if the company is a retailer in malls and the holiday selling season was ending, I would expect inventory to be down in a big way. In which case the description might be “Inventory was down as we reduced holiday season inventory.” I also like to look at DIO (days inventory outstanding). DIO is a great metric for looking at inventory relative to how many days of cost of goods sold are sitting in inventory. I almost always have a goal to reduce DIO or at least hold it steady. So, I would be curious to see how that metric ended the month and I might include a mention of it in the explanation if DIO had moved much. I’ll talk more about DIO in just a minute.
A negative adjustment – A negative adjustment to cash related to inventory indicates you bought more inventory during the month than you sold. (Inventory on your balance sheet went up for the month.) Creating your one line explanation is similar to what we just discussed. The question is what caused the change. I look at an increase in inventory very closely. I view inventory as a “necessary evil” so I am leery when inventory goes up. I want to make sure there is a good reason for the increase and that it is consistent with the plan and expectation. If we use the same example where the company is a retailer in malls, but assume their inventory grew, I would be looking to see whether the increase is consistent with the plan. And I would look at the amount of the inventory increase to make sure it was not too much of an increase. Inventory is an asset that must be managed very closely because it is surprisingly easy to lose money if you let inventory get out of hand. I’ll talk more about how to manage inventory well in just a minute.
Labeling the Change as Good or Bad – Deciding whether the change, positive or negative, is good or bad depends on whether the change in inventory was by design. Most changes will be considered good unless they come as a surprise to you. Or if the change is going the wrong direction relative to your sales plan. I mentioned earlier that I consider inventory to be a necessary evil. It is necessary in that you can’t make the sale to a customer if you don’t have the product in stock. If you bring inventory down too much, you may lose sales. Or make customers unhappy. On the other hand, inventory is evil in that it is an accident waiting to happen (in the form of an additional expense or loss). Inventory can get old, outdated, damaged, stolen or otherwise go down in value and possibly never sold. Buying inventory, then never selling it, or selling it at a steep discount, can be a profit killer.
Let’s look at an example from Cory’s business. Cory and his partner own a small multi-unit retailer. Last month inventory was one of the three largest drivers of cash. The change in inventory was $41 thousand. When the inventory driver produces a positive number in your focus report (a positive adjustment to cash), that means you sold more inventory to customers than you purchased from vendors during the month. His one line explanation said: “Inventory was down in line with our goal to reduce overall inventory levels.”
He labeled the inventory driver as “Good” because Cory and his store managers had been working for the last two months to bring inventory levels down. They had set a goal to get their DIO down from about 70 to 55. The $41 thousand reduction last month was a nice step toward achieving that goal. It was adding to their cash balance at a rate consistent with their plan.
Managing Inventory Wisely
Inventory can be a very fickle asset. One minute it’s your best friend. The next minute it’s your worst enemy. When you buy inventory, the transaction is recorded as an addition to inventory on your balance sheet (not in your P&L). The you hold the inventory for some period of time until it is sold. Then the expense for that inventory is recorded in your P&L at the time it is sold. While you are buying inventory and paying for it, the cash is leaving your bank account… but there is no recognition of those purchases as an expense in your P&L. It’s the timing of buying the inventory and later recording the expense that makes inventory such a unique animal.
When I think about how to evaluate and monitor inventory in a business, I start with a big picture, top down view. And within that view I look at it from two perspectives.
- The impact on cash – The first perspective is how much cash is tied up in inventory and how long is that cash being tied up. As a general rule, the lower the inventory balance and the less time we hold that inventory before selling it the better. The focus here is on the time from purchase from the vendor to sale to the customer.
- The impact on profitability – The second perspective relates to the impact inventory has on overall profitability as well as the many pitfalls associated with how inventory is accounted for.
Let’s look at some ways to get better at managing inventory.
Measure and Monitor DIO (Days Inventory Outstanding)
My favorite big picture metric for monitoring inventory, and the speed in which we turn that inventory into cash, is DIO. DIO stands for days inventory outstanding. Or days of inventory on hand. It is the number of days of cost of sales that are sitting in inventory. I monitor DIO monthly to see how the metric is trending. If we have specific goals or targets set for DIO, I am looking to see that we are on track to hit or maintain the goal. If we don’t have specific goals set, I am on the lookout for any increase in DIO that would suggest that the speed in which we are turning inventory into cash is slowing.
Cory’s small, multi-unit retail business in shopping centers is a good example. He owns and operates a small, multi-unit retail located in shopping centers. All his revenue comes from the sale of merchandise that he displays and sells in his stores.
Over the past two years Cory’s inventory balances had been creeping up. Never a big increase in any given month. But over time, the amount of inventory, and therefore the amount of cash invested in inventory, was growing relative to their sales volumes. And Cory was starting to see some signs that concerned him, including:
- The amount of inventory that had to be marked down in order to sell it was going up.
- The amount of damaged inventory that had to be sold for scrap was going up.
- Profitability was suffering.
- And the sign that gets most business owners attention… cash was in short supply.
Industry data made it clear he was carrying more inventory than most retailers in his industry. Finally, with the start of the new year, he convinced himself that it was time to look more seriously at the inventory issue and begin working on a plan with his store managers.
One of the goals that Cory and his team set for the second half of the year was to reduce DIO by 15% to 20%. The intent was to free up cash while also improving profitability. He had always believed that being a little heavy on inventory helped ensure he could take good care of customers when they came in one of the stores. He worried that customers would come to the store, not find what they were looking for, and become irritated. But he was becoming more and more convinced that he could do it without causing any disruption in the shopping experience. And he needed to free up some cash!
Sales did not vary a lot from month to month so the number that had the most impact on DIO was the inventory balance. After some discussion, the two of us agreed that the targeted inventory reduction would be $100 thousand. Inventory hovered around $550 thousand and our goal was to get that down to the $450 thousand range. The $100 thousand of freed up cash was going to help beef up the normal cash balance. Cash had been running too low for comfort and the mission was to maintain a healthier cash balance each month going forward.
January through June were typical of most months over the last five years. He had about 70 days of cost of sales in inventory. He and his store managers used the months of April to June to discuss, debate, and plan for how they were going to achieve the inventory reduction target. They carried a variety of product, and each store carried a slightly different mix of inventory, so planning was especially important… and very detailed. Once they had a plan that the team bought into, they got to work in mid-June.
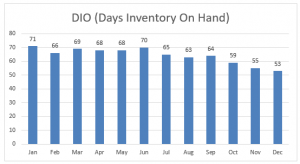
Here is a graph of DIO for each month of the year.
On the left side of the graph, you can see where they were running a DIO in the 70 range. They started their work to reduce inventory in June and you can see the results showing up in a reduced DIO over the following six months. They ended the year at 53 which was slightly better than the goal they had set.
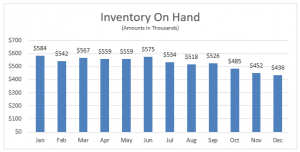
Here is a view of the inventory balance across all the stores.
On the left side of the inventory graph, you can see where they were running an average inventory balance of just over $550 thousand for the first half of the year. They began their work to reduce inventory in June and you can see the inventory start coming down over the following six months. They ended the year at $436 thousand. They had freed up over $100 thousand of cash, slightly better than the goal.
Cory felt good about hitting the target. His plan was to maintain inventory levels at the new, lower levels and monitor sales results over the next three to six months. He wanted to make sure that the lower inventory levels did not hurt sales or customer satisfaction. And he wanted to confirm that mark downs and damaged inventory costs were coming down at the rate we expected them to.
Cory’s experience highlights three points I’d like to emphasize as you use DIO as a metric for monitoring inventory.
- Put a dollar amount on your average daily cost of sales so you know how much cash you can free up by reducing DIO by one day.
- When evaluating your DIO, look at your historical DIO trend by month over the last 24 months. And compare your DIO to industry data or other companies in similar industries.
- If you decide to set goals for reducing DIO, translate your goal into a dollar amount of inventory reduction.
Let’s talk more about each of these points.
Put a dollar amount on your average daily cost of sales. DIO is calculated as the inventory balance on your balance sheet divided by average daily cost of sales. In a simple example, assume your inventory balance is $500,000. And cost of sales last month (the last 30 days) was $250,000. (I like to use cost of sales rather than sales because cost of sales equates to the cost of the inventory sold.) Average daily cost of sales would be $8,333. We take the $500,000 divided by $8,333 to get a DIO of 60. The DIO number is saying that, on average, we have 60 days of inventory on hand.
In this example, one day of inventory represents $8,333. If you can improve DIO from 60 to 50, you free up $83,333 of cash. Sometimes putting that number front and center in your mind helps provide the motivation to explore ways to move DIO down over time.
Review your historical DIO trend and compare it to similar businesses. I have to admit I am a big fan of looking at numbers visually in addition to just the raw numbers in a spreadsheet. I frequently look at a company’s DIO as a graph over the last 24 months. I like to see the trend, the trajectory, of DIO in a graphical view because the trends, the trajectory on inventory values, almost jumps off the screen at you. It is a super-fast way to find out if you should be worried about inventory or not. It provides the big picture view of whether you might have an inventory issue that needs attention.
I also compare the overall DIO numbers to industry data. Many businesses have an industry association that provide financial data and metrics that include a DIO metric. Or they include enough information where you can calculate an estimate of DIO for the average business in your industry. I don’t view the industry number has gospel. I just use it as a ballpark number so I have a general idea of what the norm might be for a similar business. If our DIO is way out of line, I consider that a good reason to peel the onion and look more closely at how you are managing inventory levels and look for ways to speed up the flow of inventory through your company.
I also look to see if there are public companies in a similar line of business. Public companies publish their financial statements for all to see. It can be a fantastic way to get DIO and other financial metrics and information to use a reference point. Like industry data, I don’t view it as gospel. It is just additional information that is often helpful as we work on our never-ending goal to survive and thrive in business.
If you are planning to reduce DIO, put a dollar amount on your inventory reduction goal. Once you have decided to reduce DIO, or otherwise free up some of the cash you have invested in inventory, it is important to express your inventory reduction goal as a dollar amount. In Cory’s business, he set a target of a $100 thousand reduction. That helped to clarify for his team the degree of reduction he was after. And it makes it easier for everyone to quickly compare their actual inventory reduction results against the goal each month.
Pay Close Attention to the Accounting for Inventory
I have a great example to share with you that demonstrates the unique nature of how inventory, and the accounting for inventory, can sneak up on you and bite you in the behind. I did some work years back with an owner who did a good job of reviewing the P&L each month. He was very involved in the monthly review of revenues, expenses and profit before the monthly financial statements were finalized. What he had not done quite as well was reviewing the amount of cash his stores were using each month to purchase inventory. Over time, he began to receive requests to rent temporary storage capacity for certain product to make more room in the stores. Which sounded odd to him. And the cash balance was headed in the wrong direction. That’s when the alarm bells began going off in his head.
After digging into the issue, he discovered that the stores had about twice as much inventory on the books as they should have. They had been consistently buying more inventory than they were selling. To the point that some of the inventory had been moved to storage locations because there was not enough room for it in the stores. It became clear that he and his team had not been paying attention to inventory (to put it nicely).
Much of the product had to be marked down 60–80 percent in order to sell it and clear out the excess inventory. The good news was they were able to generate some cash. The bad news was they had to do it at a big loss. And it was only at this point that the reality of this loss was shown in the P&L.
Here is the important point. During the time this inventory train wreck was happening the P&L looked great. The business was showing a consistent profit and he and his team felt good about it. The accounting for inventory puts it on the balance sheet when it is purchased. It is only moved to the P&L as a cost of goods sold when the product sells. You have to pay close attention to inventory balances and DIO, in addition to profitability, in order to make sure you are not tying up too much cash in inventory.
Here are three principles to keep in mind:
- Understand how inventory creates expense in your P&L.
- Pay attention to cost of goods NOT sold.
- Treat inventory like its cash.
Understand how inventory creates expense in your P&L. Most of the costs associated with inventory show up in the cost of goods sold line in your P&L. These include the cost of the product itself as well as costs associated with inventory spoilage, obsolescence, damage, and theft (to name a few). There are other costs associated with inventory including the cost to store, finance, protect, insure, move, and manage inventory that may or may not be recorded as cost of goods sold.
In many businesses, cost of goods sold is the single largest expense in the business. Sales minus cost of goods sold is gross profit. A strong gross profit is the key to creating a healthy business. It is almost impossible to bring a nice profit down to the bottom line without a healthy gross margin.
My favorite metric for tracking the health and direction of gross profit is gross margin. Gross margin is simply gross profit divided by sales. In many businesses, improving gross margin by even two points can be the difference between making money and losing money. I monitor this very closely every month to see that it is trending in the right direction (or at least remaining steady).
Make sure the process for recording cost of goods sold in your P&L is proper (and accurate). Sometimes accountants will use estimates to record cost of goods sold (which means an estimate is being used to record the value of the inventory that was sold). If that is the case, it is wise to do a physical count of your inventory on a regular basis to make sure the inventory on your balance sheet, and the cost of goods sold in your P&L (and therefore your gross margin), is accurate.
Pay attention to cost of goods NOT sold. I like to refer to inventory costs like spoilage, obsolescence, damage, and theft as cost of goods not sold. It’s what happens when you bought inventory with the intent to sell it at specific profit, but something happened along the way to spoil those plans. And it hurt your profit as a result. Either because you could not sell the product at all or because you had to mark it down and sell it at a discount which reduced your gross margin.
These costs tend to sneak up on people. Here is how it usually happens. Inventory slowly builds for a while. The slow or non-moving inventory gets pushed aside and ignored because the focus is usually on the faster moving inventory. Management can’t see the scope of the problem because they are focused on the P&L and not on the balance sheet. They may be paying attention to cost of goods sold, but they aren’t paying attention to the cost of what’s NOT being sold. Why? Because it is sitting on the balance sheet where it is not so obvious that a problem is brewing.
Eventually though, reality raises its ugly head and you have to do the work to dig into the inventory detail, figure out what product has gone bad, mark it down, take a big inventory write-down that flows through the P&L, then get rid of the old inventory in an attempt to salvage at least a little bit of the cash that was used to buy the inventory in the first place.
You would be surprised how many business owners are making important business decisions based on what their P&L says about gross profit only to discover later that the gross profit number was wrong. The revenue was correct. But the cost of goods sold was wrong. And the error is almost always on the side of showing cost of goods sold that is lower than the real cost. The result is an inflated gross profit… and misguided decisions (especially about pricing).
Treat inventory likes its cash. Let’s say you have inventory in a store or warehouse that you bought for $100,000. Over time you ordered the product, paid for the product, and that $100,000 is no longer in your bank account. In its place is $100,000 of product that you have available for sale to customers. Just for fun, think about that inventory as stacks of $100 bills sitting on shelves and pallets in your store or warehouse. A total of $100,000 of cold, hard cash sitting there in boxes. Would you protect and safeguard it differently if it was actual cash? Would you carefully monitor how much went in and out of the warehouse? Would you ensure it is accounted for accurately? Absolutely.
Here is a fun way to take a first step toward paying closer attention to inventory. Print a listing of your entire inventory by date purchased. Take a walk with the person in charge of inventory and physically look at and touch all the inventory. Ask questions about anything that looks old or has been around for a while. Make a mental note about the answers you get. You will get people’s attention when you do that.
Make an honest assessment of which inventory items are damaged, worthless, or obsolete. Have questionable inventory segregated so it is easy to monitor going forward. Identify inventory that is slow moving. Not only will you discover some worthless inventory you need to write off and get rid of, you will also be reminding yourself how important it is that you manage your inventory very, very closely. Consider writing down the value of questionable inventory so you have a more accurate inventory number on your balance sheet.
Spend some time with the person responsible for buying inventory. Evaluate the process they use to make buying decisions. Buyers are sometimes conflicted when it comes to buying. Especially when it comes to buying in quantity to get better pricing. Buying in large quantities can reduce per unit costs. But it can also drive inventory levels up too high. And when inventory levels are too high you end up eating a lot of that inventory in the form of spoilage, obsolescence, damage and other hard to swallow surprises. Consider putting additional controls in place at the point of each order if you believe the buying process needs improvement. That’s the point in the process where you can save yourself loads of cash and avoid big write-downs in the future.
Understanding the Drivers of Cash Flow – Accounts Payable
In my next post in this series I talk about the impact accounts payable has on your cash flow and how it will show up in your Cash Flow Focus Report.
You have accounts payable when you record a vendor invoice in your accounting system but have terms that allow you to pay the invoice later. An example might be a utility bill. You receive an invoice for the services provided in the prior month but have ten or more days to pay the invoice.
When accounts payable is one of the three largest drivers of cash, the number you will be entering is the change in your accounts payable balance for the month. Entering this amount “adjusts” for the expenses or purchases that did, or did not, get paid during the month.
Summary and Links to Other Posts in This Series
Here is a short recap and a link to each blog post in this series on making your cash flow simple and easy-to-understand.
Part 1 – The surprising results of my super-short survey that asked: “How do YOU define cash flow in your business”?
Part 2 – “Cash flow” is not a single number on your financial statements. Now is the time to totally rethink (and greatly simplify) how you go about understanding and managing cash flow in your business.
Part 3 – I use a VERY different, simple approach to defining cash flow. It is an approach where I take my CPA and CFO hat off and speak in a common-sense language that you can relate to.
Part 4 – The Cash Flow Focus Report is a simple, common sense tool for understanding your cash flow that takes 10 minutes a month. It brings focus to your cash flow, simplifies your life, and leads to an understanding and sense of confidence that you will find freeing.
Part 5 – The four reasons cash flow has always been so confusing and complicated for business owners (and for bookkeepers and accountants too).
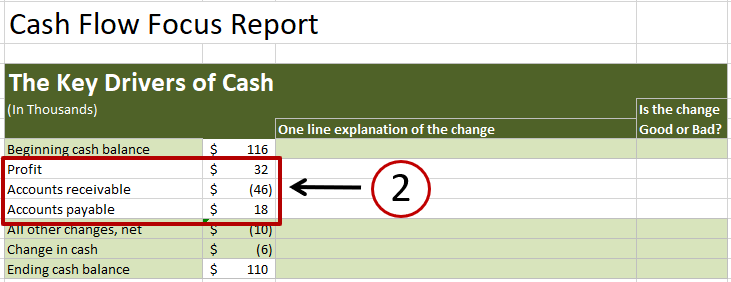
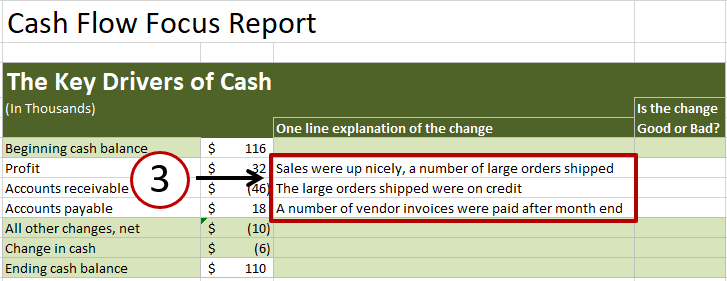
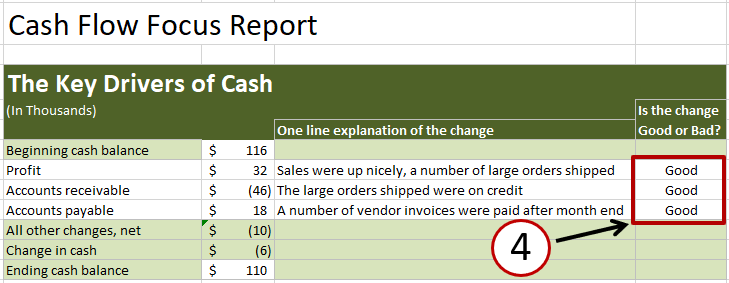
Part 6 – I show you the 4-step process for completing the Cash Flow Focus Report. I walk through each step in the process using a real-life small business example. It’s a cool little company that was founded almost 20 years ago. It has grown nicely over the years and the owners love the business. Last month, the business showed a profit of $32 thousand. But their cash balance went down during the month by $6 thousand (from $116 thousand down to $110 thousand). The Cash Flow Focus Report shows what caused the change in cash.
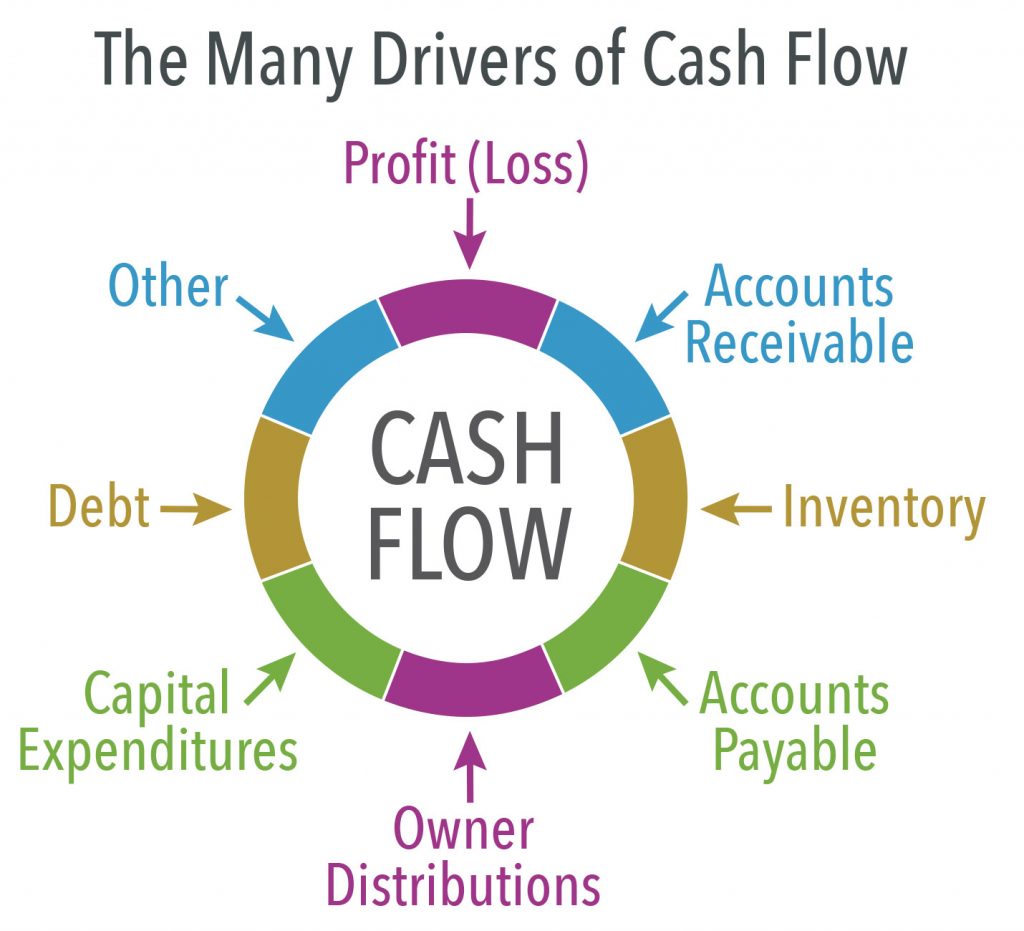
Understanding the Drivers of Cash Flow – There are a number of different drivers of cash (in addition to profit or loss) that you will encounter as you complete the Cash Flow Focus Report each month. You will not run into all of them in one month because we are only focusing on the three largest changes, or drivers, of cash for each month. But as each month goes by, you will eventually see each one of these drivers impact your cash.
Understanding the Drivers of Cash Flow – Profit or Loss – Over time, profitability is a super important driver of your cash flow. You want to see profit show up in the list of your three largest drivers of cash regularly. While it is not unusual to have a month where profit does not make the list of top three drivers, profit needs to be there often, or you likely have a problem that needs attention. We also look at a number of ways to improve your profitability.
Understanding the Drivers of Cash Flow – Accounts Receivable – If you sell products or services on terms where customers do not have to pay you at the time you make the sale, you will have accounts receivable. And you will find that accounts receivable show up frequently as one of the three largest drivers of cash each month. I also share four steps for managing accounts receivable wisely.
Philip Campbell is an experienced financial consultant and author of the book A Quick Start Guide to Financial Forecasting: Discover the Secret to Driving Growth, Profitability, and Cash Flow and the book Never Run Out of Cash: The 10 Cash Flow Rules You Can’t Afford to Ignore. He is also the author of a number of online courses including Understanding Your Cash Flow – In Less Than 10 Minutes. His books, articles, blog and online courses provide an easy-to-understand, step-by-step guide for entrepreneurs and business owners who want to create financial health, wealth, and freedom in business.
Philip’s 35 year career includes the acquisition or sale of 35 companies (and counting) and an IPO on the New York Stock Exchange.
Understanding Your Cash Flow – In Less Than 10 Minutes
This online course teaches you the step-by-step process for simplifying your cash flow. I walk you through each lesson while you watch, listen, read and try it yourself using your own cash flow numbers.
The course is very affordable. And there are also some coaching options available if you would like to get up and running fast.
It’s a fantastic way to learn the process.
I take all the risk out of your purchase because I include a 100%, no questions asked, money-back guarantee. You love it or you get your money back in full. Period.
There are two things that are very unique and exciting about this online course.
1. I’ll show you how to understand your cash flow in less than 10 minutes
2. I’ll show you how to explain what happened to your cash last month to your business partner or banker (or maybe even your spouse) in a 2-minute conversation.
I take off my CPA hat and I speak in the language every business owner can relate to. No jargon. No stuffy financial rambling. Just a simple, common sense approach that only takes 10 minutes a month.
Here is how one business owner describes the benefits of the course.
“I googled cash flow projections and found your website online and it appealed to me mainly due to the fact that you speak in laymen’s terms in a way that a non-financially trained person can understand.
The fact that you said you can understand your cash flow in less than 10 minutes a month was also a big reason I bought it. And the fact that you acknowledge that most accountants and CPA’s speak in terms that the normal owner cannot understand and that you would be able to put things in understandable terms really got me.
The monthly cash flow focus report was the best feature for me because learning to do it helped me understand my cash flow statements and the biggest drivers of cash flow.
Another significant benefit is the definitions of cash flow drivers and descriptions of how a negative or positive sway in cash within those drivers affects cash flow. Being able to see at a quick glance monthly what happened to your cash using the focus report is a huge benefit.”
